 Overview & When to Use
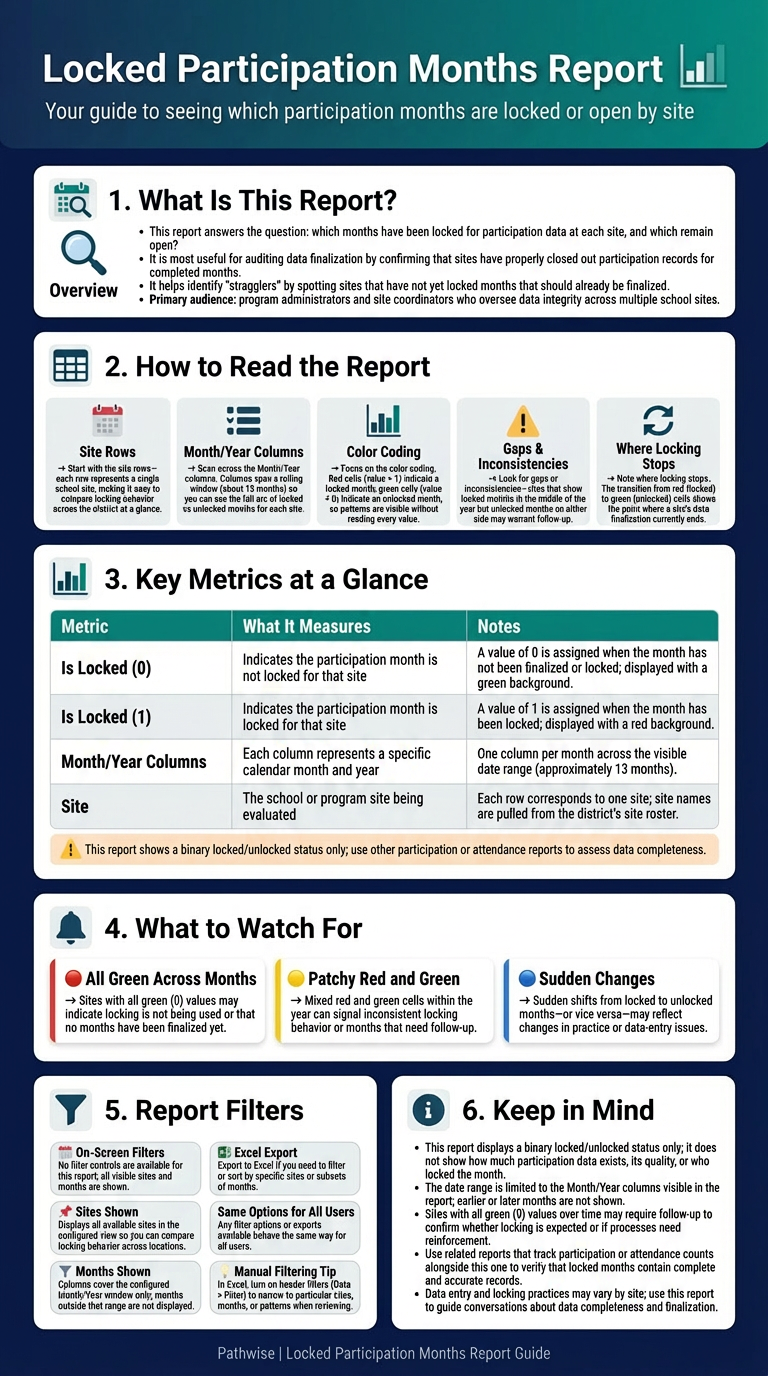
This report answers the question: Which months have been locked for participation data at each site, and which remain open? It is most useful for:
- Auditing data finalization — confirming that sites have properly closed out participation records for completed months.
- Identifying stragglers — spotting sites that have not yet locked months that should already be finalized.
The primary audience is program administrators and site coordinators who oversee data integrity across multiple school sites.
How to Read the Report
- Start with the site rows — each row represents a single school site, making it easy to compare locking behavior across the district at a glance.
- Scan across the Month/Year columns — columns span a rolling 13-month window, allowing users to see the full arc of locked vs. unlocked months for each site.
- Focus on the color coding — red cells (value = 1) indicate a locked month; green cells (value = 0) indicate an unlocked month. This makes patterns immediately visible without reading individual values.
- Look for gaps or inconsistencies — a site that shows locked months in the middle of the year but unlocked months on either side may warrant follow-up.
- Note where locking stops — the transition from red (locked) to green (unlocked) cells shows the point at which a site’s data finalization ends.
Key Metrics
| Metric | What It Measures | How it is Calculated | Notes |
| Is Locked (0) | Indicates the participation month is not locked for that site | A value of 0 is assigned when the month has not been finalized/locked | Displayed with a green background |
| Is Locked (1) | Indicates the participation month is locked for that site | A value of 1 is assigned when the month has been locked | Displayed with a red background |
| Month/Year columns | Each column represents a specific calendar month and year | One column per month across the visible date range | Columns span approximately 13 months |
| Site | The school or program site being evaluated | Each row corresponds to one site | Site names are pulled from the district’s site roster |
Statuses, Colors, and Alerts
- 🟥 Red cell / Value = 1 — The participation month is locked for that site. Data entry for that month is closed.
- 🟩 Green cell / Value = 0 — The participation month is not locked for that site. Data entry remains open.
- No additional status flags, icons, or alert indicators are visible in this report beyond the binary locked/unlocked color coding.
Notes, Limitations, and Related Reports
- This report displays a binary locked/unlocked status only — it does not show the volume of participation records, the quality of data entered, or who performed the lock action.
- The date range shown is fixed to the columns visible in the report; months outside that window are not displayed.
- Sites with all green (0) values across all months may indicate either that locking is not being used or that no months have been finalized.
- Related reports that track participation counts or attendance data would be needed alongside this report to assess whether locked months contain complete and accurate records.
Report Filters
No filter controls are available for this report. The report displays all available sites and all available months within the configured date range. Users wishing to focus on a specific site or subset of months would need to export the data and filter manually.
To apply filters (not available for all reports), use the filter icon available at the top right of the report header. The filter options shown in this report are the same for all users.
To filter by additional fields that are not available on-screen, export the table to Excel, turn on filters for the header row (Data > Filter), and use Excel’s filter dropdowns. For a quick tutorial, see Microsoft’s “Filter data in a range or table” video on https://support.microsoft.com/.
Updated