 Overview & When to Use
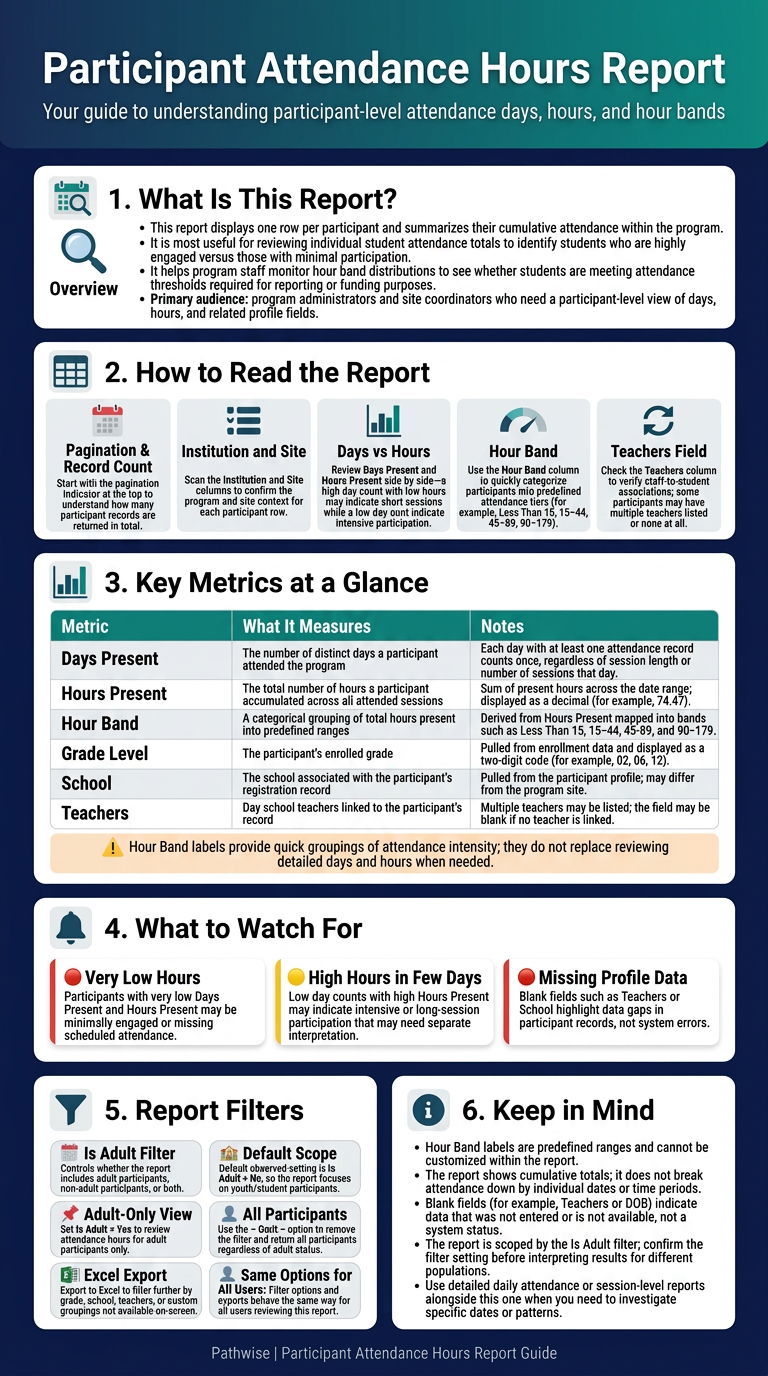
This report displays one row per participant and summarizes their cumulative attendance within the program. It is most useful when:
- Reviewing individual student attendance totals to identify students who are highly engaged versus those with minimal participation.
- Monitoring hour band distributions to understand whether students are meeting attendance thresholds required for reporting or funding purposes.
- Auditing participant records by cross-referencing participant IDs, grade levels, school assignments, and linked teachers.
The primary audience includes program administrators and site coordinators.
How to Read the Report
- Start with the pagination indicator at the top of the report to understand the total number of participant records returned (e.g., 120 records across pages).
- Scan the Institution and Site columns to confirm the program and site location context for each row.
- Review Days Present and Hours Present side by side — a high day count with low hours may indicate short sessions, while a low day count with high hours may indicate intensive participation.
- Check the Hour Band column to quickly categorize participants into attendance tiers (e.g., Less Than 15, 15–44, 45–89, 90–179) without needing to calculate from raw hours.
- Use the Teachers column to verify staff-to-student associations, noting that some participants may have multiple teachers listed or none at all.
Key Metrics
| Metric | What It Measures | How it is Calculated | Notes |
| Days Present | The number of distinct days a participant attended the program | Count of attendance days recorded for the participant – one session attendance on a day will count that date. | A single day counts only once regardless of session length or number of sessions attended on a day |
| Hours Present | The total number of hours a participant accumulated across all attended sessions | Sum of hours present in date range for all attended sessions | Displayed as a decimal (e.g., 74.47) |
| Hour Band | A categorical grouping of total hours present into predefined ranges | Derived from the Hours Present value mapped to a band label | Bands observed include: Less Than 15, 15–44, 45–89, 90–179 |
| Grade Level | The participant’s enrolled grade | Pulled from participant enrollment data | Displayed as a two-digit code (e.g., 02, 06, 12) |
| School | The school the participant is associated with in their Registration record | Pulled from participant profile | May differ from the program site |
| Teachers | Day school teachers linked to the participant’s record | Teachers are linked to students in the Teacher section of the student’s registration record | Multiple teachers may be listed; field may be blank if no teacher is linked |
Statuses, Colors, and Alerts
- Hour Band labels serve as the primary categorical indicator in this report. They allow quick visual grouping of participants by attendance intensity without requiring manual calculation.
- No color coding or alert flags are visible in this report. There are no status icons, warning indicators, or conditional formatting.
- Blank fields (e.g., Teachers, DOB) indicate that data was not entered or is not available for that participant — these are data gaps, not system statuses.
 Notes, Limitations, and Related Reports
- The Teachers column can contain multiple staff names for a single participant, reflecting multi-teacher associations. Blank values indicate no teacher association on record.
- The report is filtered to show non-adult participants only (Is Adult = No), meaning adult learners or staff enrolled as participants are excluded from the default view.
- The report shows cumulative totals — it does not break down attendance by individual session dates or time periods within the view.
- Hour Band groupings are predefined ranges and cannot be customized within the report itself.
Report Filters
The following filter is visible and active in this report:
- Is Adult — Controls whether the report includes adult participants, non-adult participants, or both. When set to No, only participants flagged as non-adults are shown. When set to Yes, only adult participants appear. The – Omit – option removes the filter entirely, returning all participants regardless of adult status. The default active selection observed is No, meaning the report is scoped to youth/student participants by default. This filter is important for programs that serve both youth and adult populations and need to report on them separately.
To apply filters (not available for all reports), use the filter icon available at the top right of the report header. The filter options shown in this report are the same for all users.
To filter by additional fields that are not available on-screen, export the table to Excel, turn on filters for the header row (Data > Filter), and use Excel’s filter dropdowns. For a quick tutorial, see Microsoft’s “Filter data in a range or table” video on https://support.microsoft.com/.
Updated