 Overview & When to Use
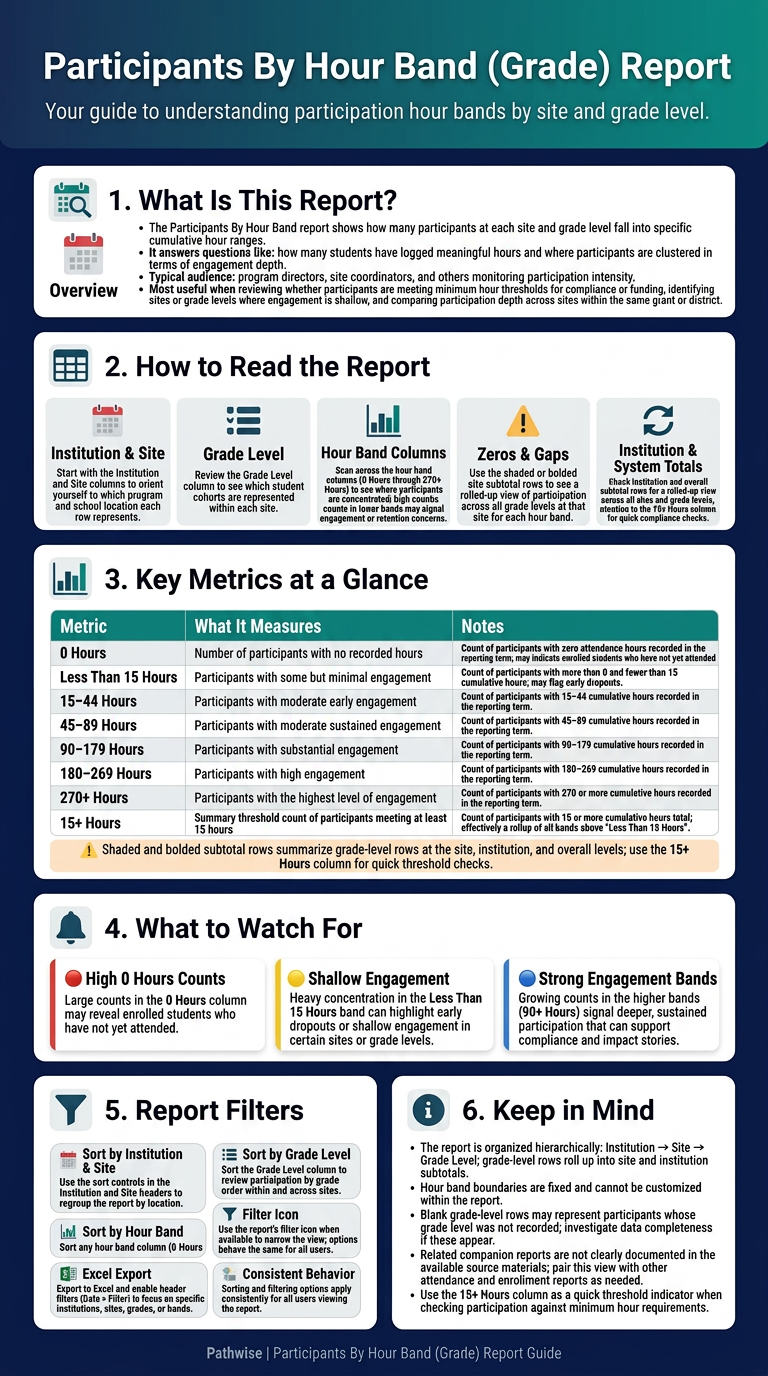
The Participants By Hour Band report shows how many participants at each site and grade level fall into specific cumulative hour ranges. It answers questions like: How many students have logged meaningful hours? Where are students clustered in terms of engagement depth?
Typical audience: Program directors and site coordinators and others monitoring participation intensity.
This report is most useful when:
- Reviewing whether participants are meeting minimum hour thresholds for program compliance or funding requirements.
- Identifying sites or grade levels where engagement is shallow (e.g., concentrated in “Less Than 15 Hours”).
- Comparing participation depth across multiple sites within the same grant or district (institution).
 How to Read the Report
- Start with the Institution and Site columns on the left to orient yourself to which program and school location you are viewing.
- Review the Grade Level column to understand which student cohorts are represented within each site;
- Scan across the hour band columns (0 Hours through 270+ Hours) to see where participants are concentrated — high counts in lower bands may signal engagement or retention concerns.
- Check the site subtotal rows (shaded/bolded rows for each site) to get a rolled-up view of participation across all grade levels at that site for each hour band.
- Check the institution subtotal rows (shaded/bolded rows for each institution) to get a rolled-up view of participation across all grade levels at all sites for each hour band.
- Check the system/state subtotal row (shaded/bolded row at the very bottom of the report) to get a rolled-up view of participation across all grade levels at all sites at all institutions for each hour band.
- Pay attention to the 15+ Hours column on the far right, which serves as a summary threshold count, useful for quick compliance checks.
Key Metrics
| Metric | What it Measures | How it is Calculated | Notes |
| 0 Hours | Number of participants with no recorded hours | Count of participants with zero attendance hours recorded in the reporting term | May indicate there are enrolled students that have not yet attended |
| Less Than 15 Hours | Participants with some but minimal engagement | Count of participants with >0 and <15 cumulative hours recorded in the reporting term | May flag early dropouts |
| 15–44 Hours | Participants with moderate early engagement | Count of participants with 15–44 cumulative hours recorded in the reporting term | |
| 45–89 Hours | Participants with moderate sustained engagement | Count of participants with 45–89 cumulative hours recorded in the reporting term | |
| 90–179 Hours | Participants with substantial engagement | Count of participants with 90–179 cumulative hours recorded in the reporting term | |
| 180–269 Hours | Participants with high engagement | Count of participants with 180–269 cumulative hours recorded in the reporting term | |
| 270+ Hours | Participants with the highest level of engagement | Count of participants with 270 or more cumulative hours recorded in the reporting term | |
| 15+ Hours | Summary threshold count | Count of participants with 15 or more cumulative hours total recorded in the reporting term | A rollup of all bands above “Less Than 15 Hours” |
Statuses, Colors, and Alerts
- Shaded/bolded subtotal rows appear at the site, institution and system/state level summarizing all grade-level rows beneath them.
- No explicit status flags, warning icons, or color-coded legends are used in the report.
Notes, Limitations, and Related Reports
- The report is organized hierarchically: Institution → Site → Grade Level. Users must be aware that individual grade-level rows roll up into site subtotals.
- Hour band boundaries are fixed and cannot be customized within the report view.
- A blank grade level row may appear for some sites, which may represent participants whose grade level was not recorded; users should investigate data completeness if these rows are present.
- Related reports are not clearly documented in the source materials.
Report Filters (How to Slice the Data)
The Institution, Site, and Grade Level column headers each include sort controls indicated by the dropdown arrows visible in the header row, allowing users to sort the report by institution, site, or grade level.
The hour band columns (0 Hours, Less Than 15 Hours, 15–44 Hours, 45–89 Hours, 90–179 Hours, 180–269 Hours, 270+ Hours, and 15+ Hours) also support sorting, enabling users to rank sites or grade levels by participation volume within any given band.
To apply filters (not available for all reports), use the filter icon available at the top right of the report header. The filter options shown in this report are the same for all users.
To filter by additional fields that are not available on-screen, export the table to Excel, turn on filters for the header row (Data > Filter), and use Excel’s filter dropdowns. For a quick tutorial, see Microsoft’s “Filter data in a range or table” video on https://support.microsoft.com/.
Updated